*** This version of Confluence is for testing only and contains a copy of content from June 29th 2026. No changes will be preserved. ***

...
Then we also found that if we instead increased the d60 from 0.55 to 0.9, the graph changed to Figure 4:
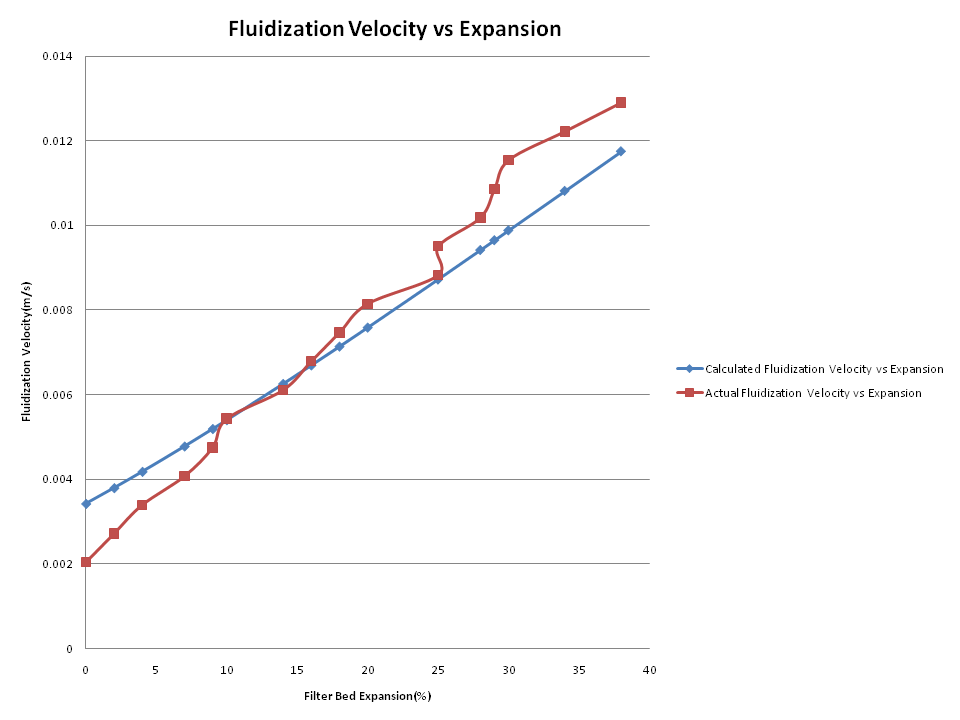
This shows that small errors in our d60 or porosity term could easily account for the major errors we have. Therefore, future experiments should carefully measure these properties before conducting experiments.
...