*** This version of Confluence is for testing only and contains a copy of content from June 29th 2026. No changes will be preserved. ***

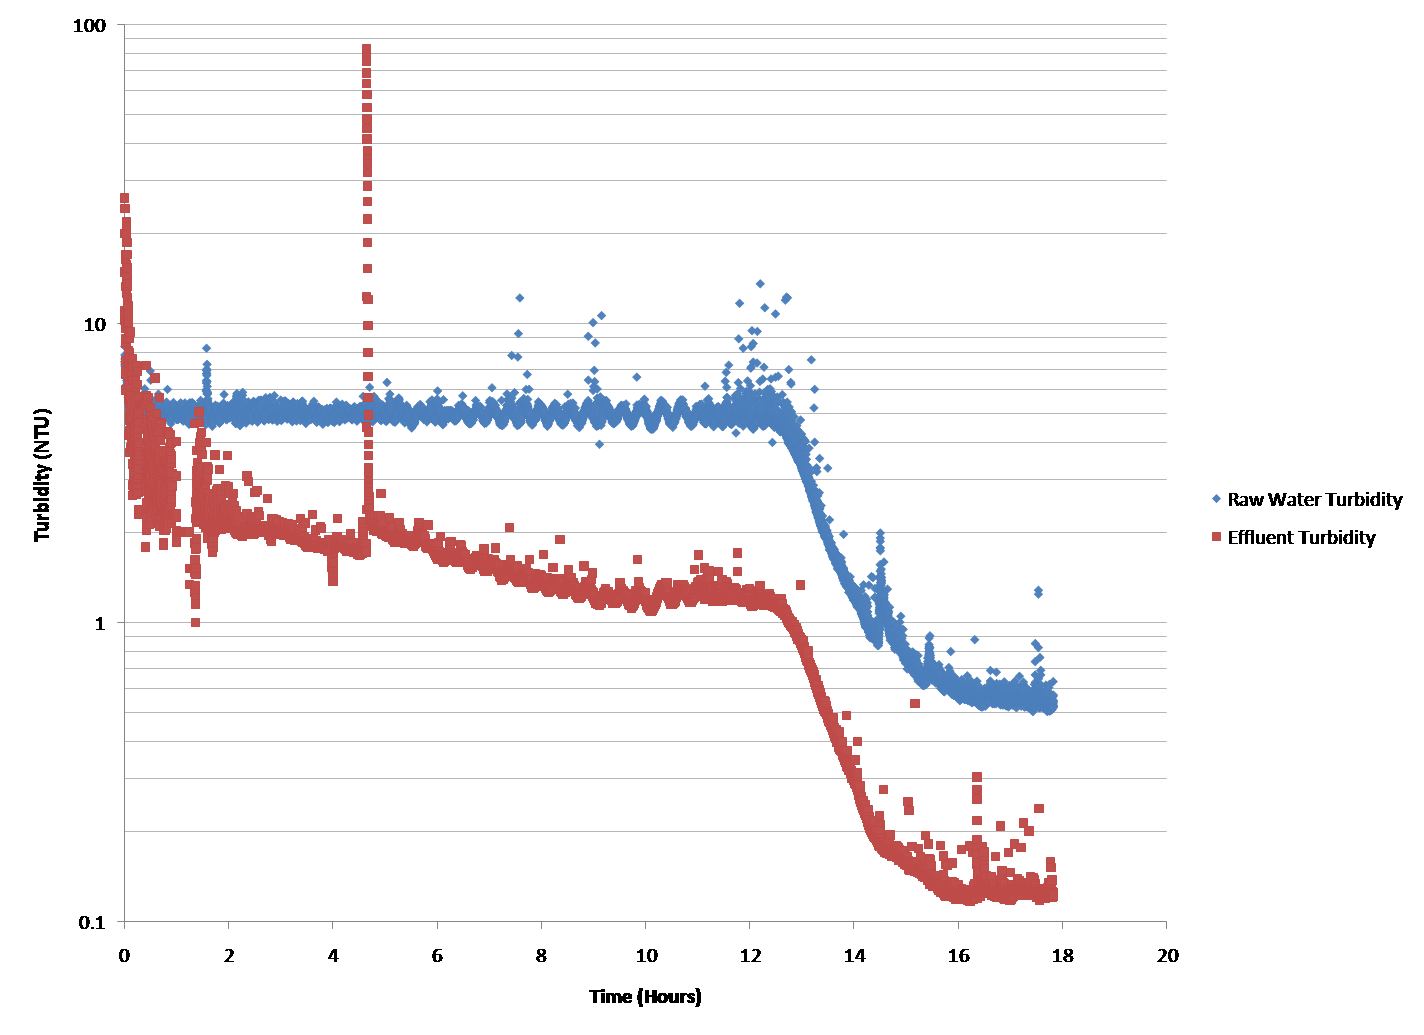
Figure 1: Raw Water and Effluent Turbidity vs time for a flow rate of 100 m/day
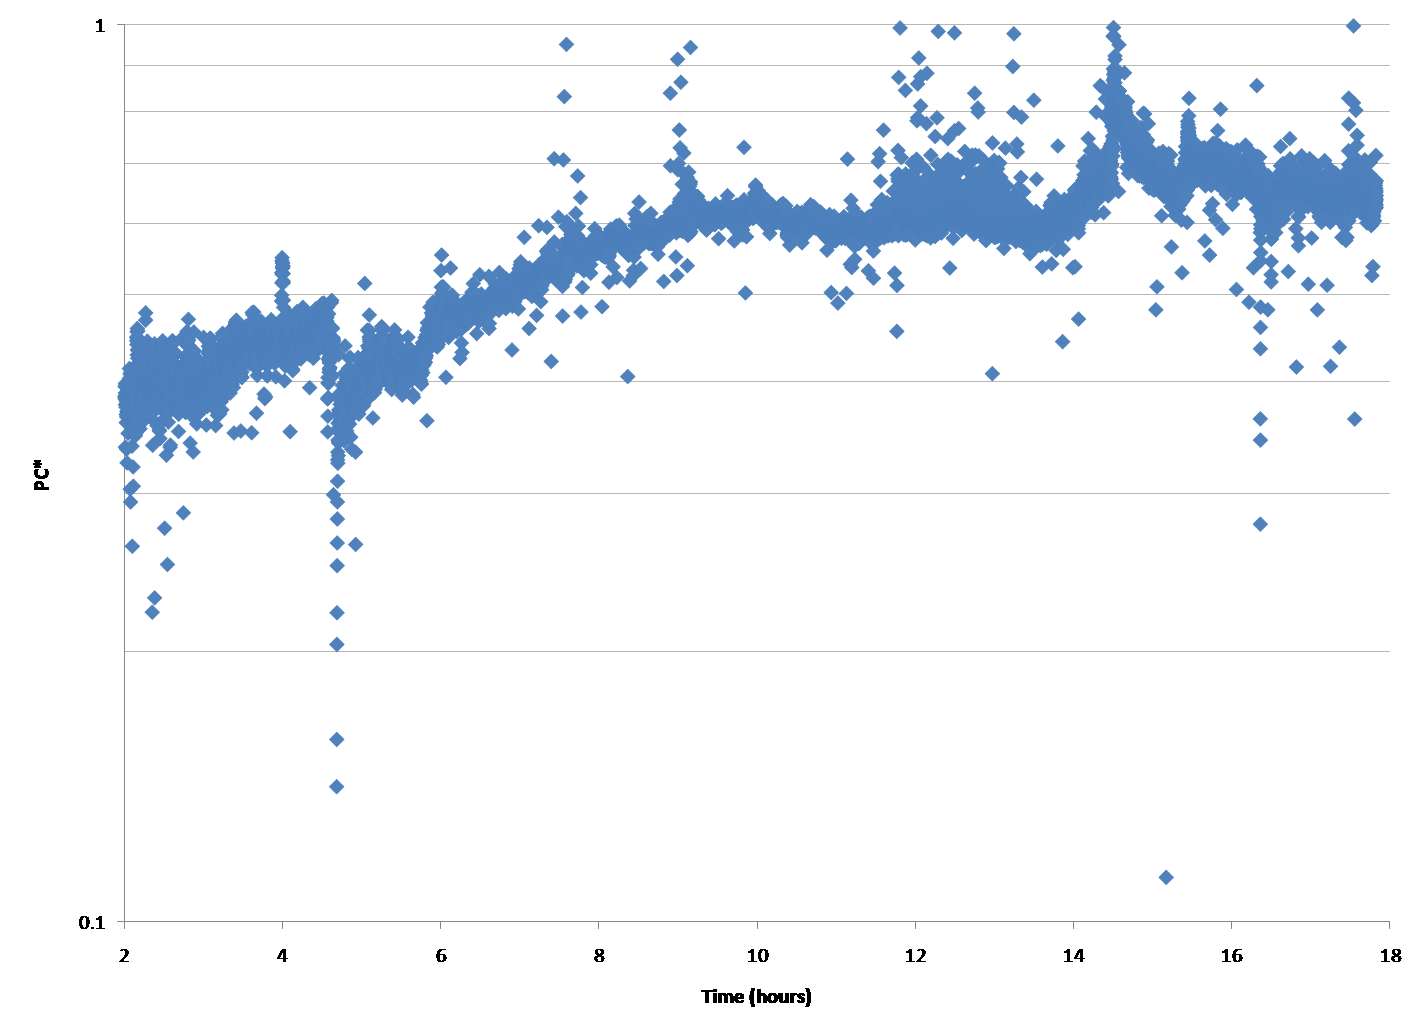
Figure 2: PC* vs time for a flow rate of 100 m/day
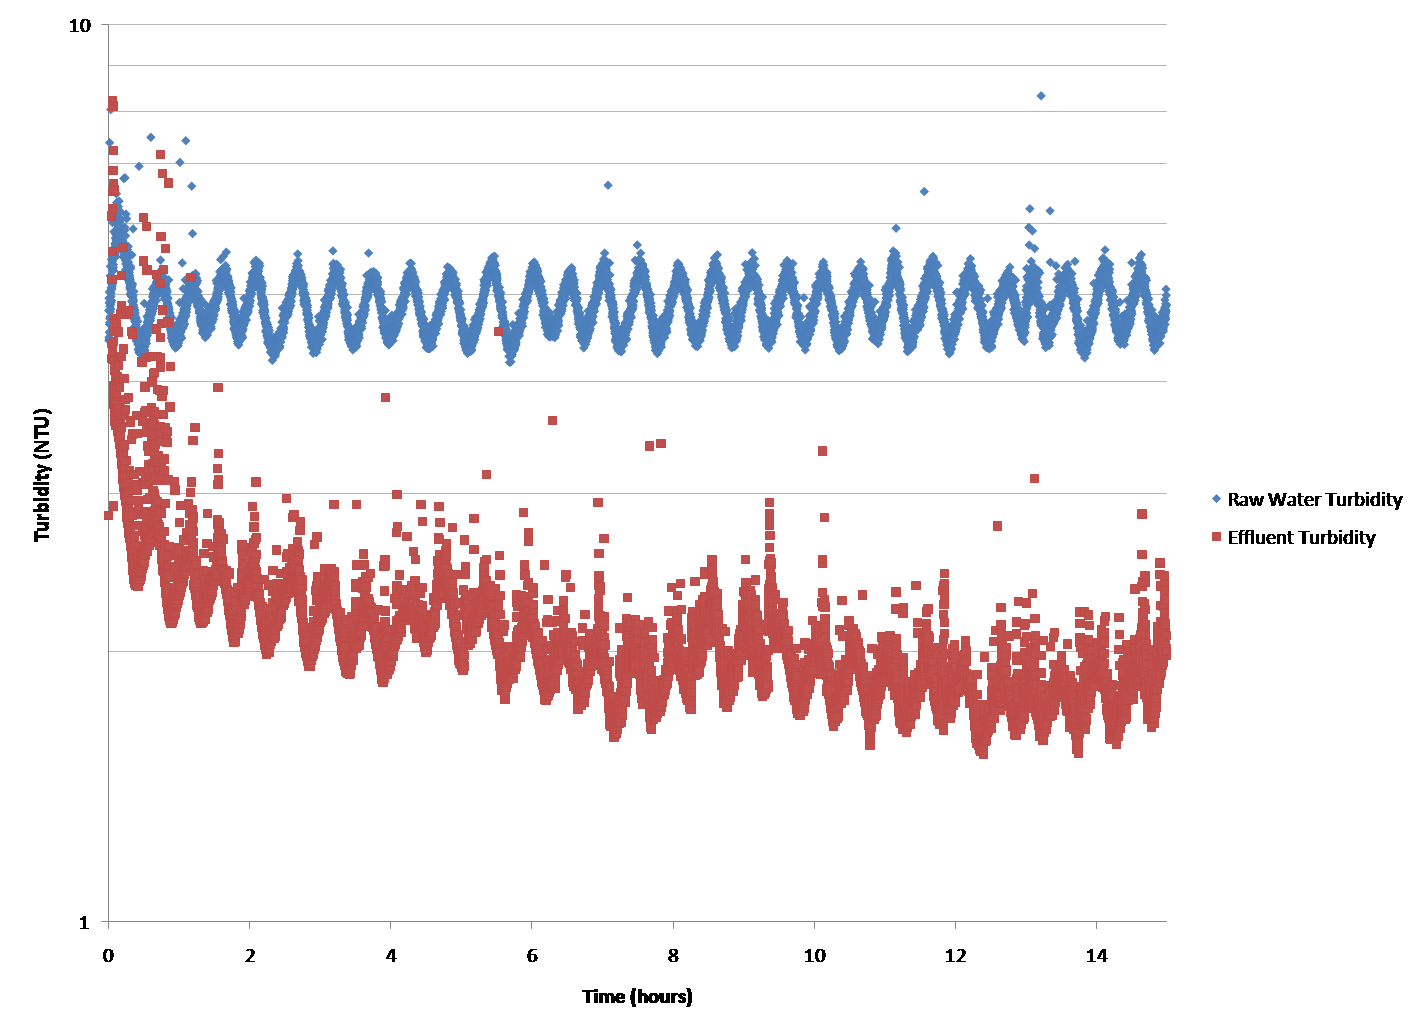
Figure 3: Raw Water and Effluent Turbidity vs time for a flow rate of 200 m/day
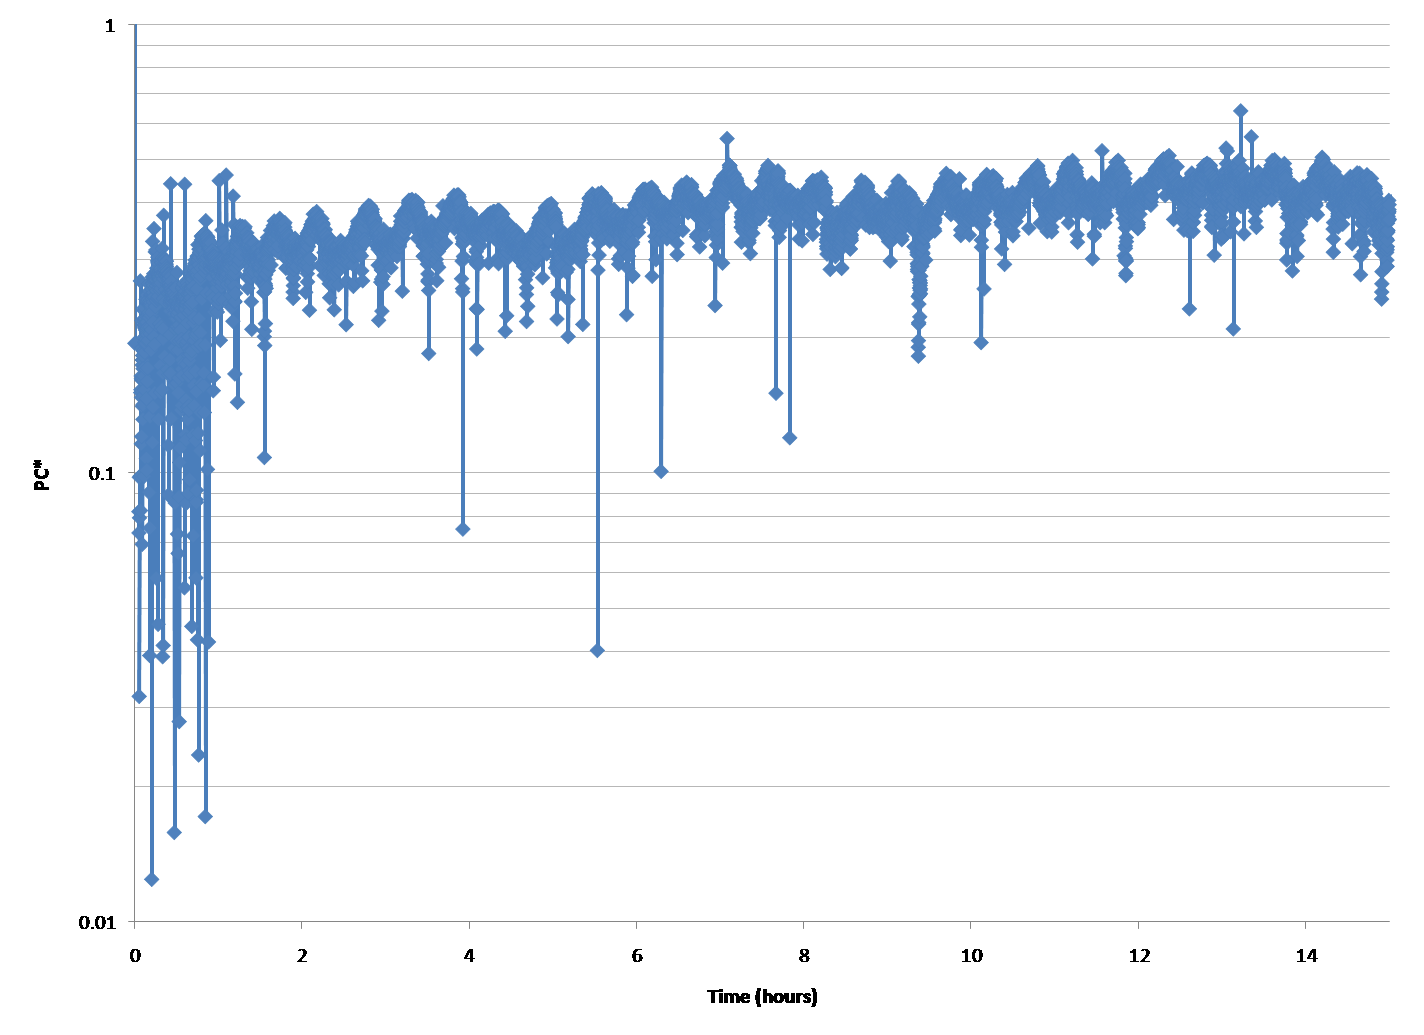
Figure 4: PC* vs time for a flow rate of 200 m/day