*** This version of Confluence is for testing only and contains a copy of content from June 29th 2026. No changes will be preserved. ***

...
1
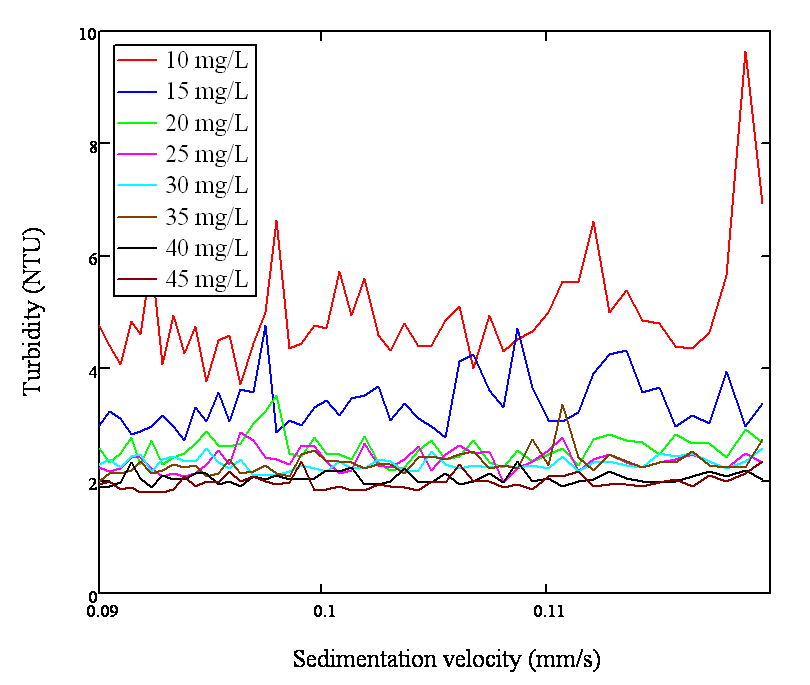
FIGURE 1: The graph plots the residual turbidity vs. sedimentation velocity for each Alum dose ranging 10 mg/L~50 mg/L
On November 17, 2009, an experiment was conducted with the turbidity set around 5 NTU, flocculator length of 8800 cm, flow rate of 5 mL/s, and alum dosage ranged from 10 to 50 mg/L.
...
2A
2B
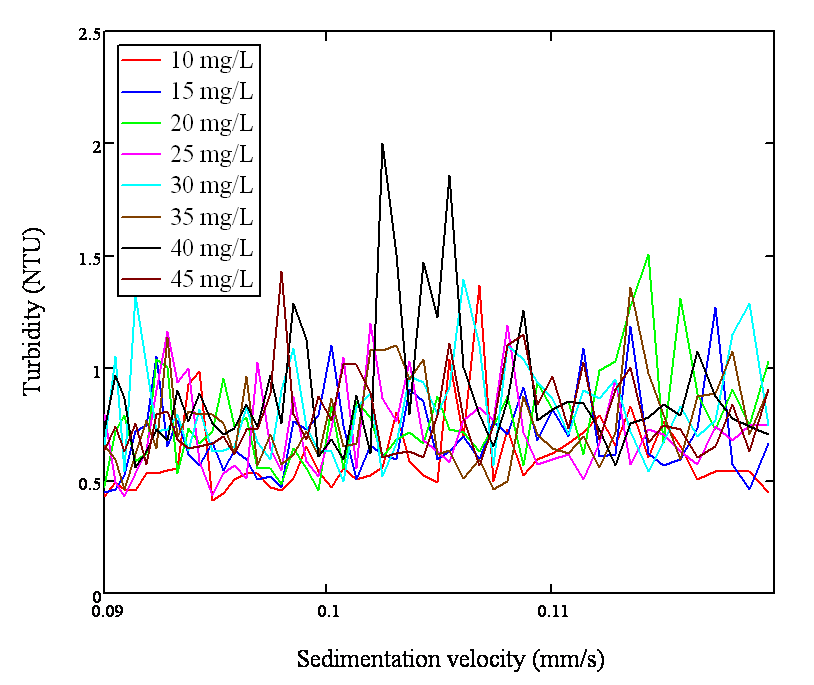
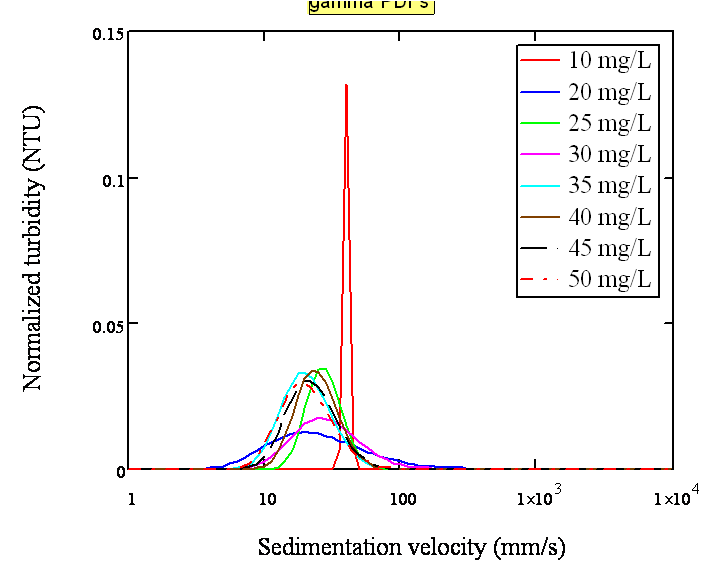
FIGURE 2A: The graph plots normalized turbidity vs. sedimentation velocity for each Alum dose ranging 10 mg/L~50 mg/L; FIGURE 2B: The graph plots the residual turbidity vs. sedimentation velocity for each Alum dose ranging 10 mg/L~50 mg/L
On November 11, 2009 (Don't date experiments), an experiment was conducted with the turbidity set around 25 NTU, flocculator length 2796 cm, flow rate of 5 mL/s, and alum dosage ranged from 10 to 50 mg/L.
...
3A 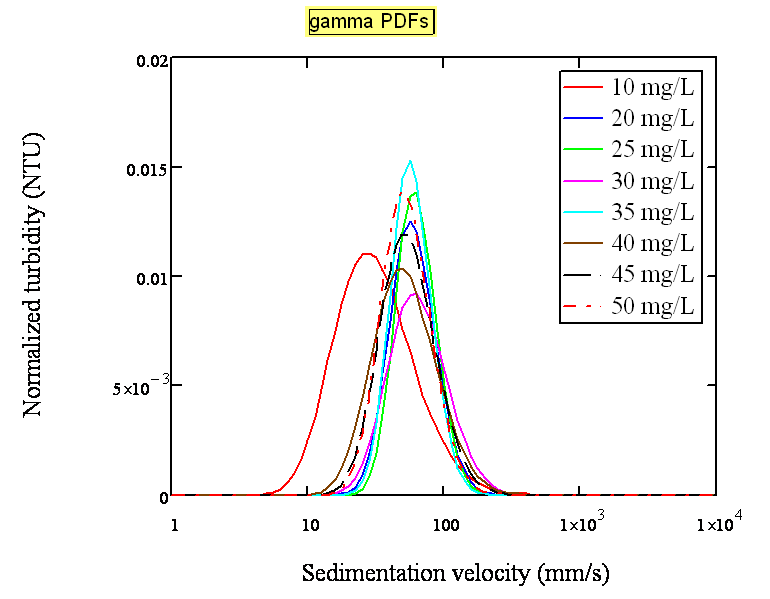
3B 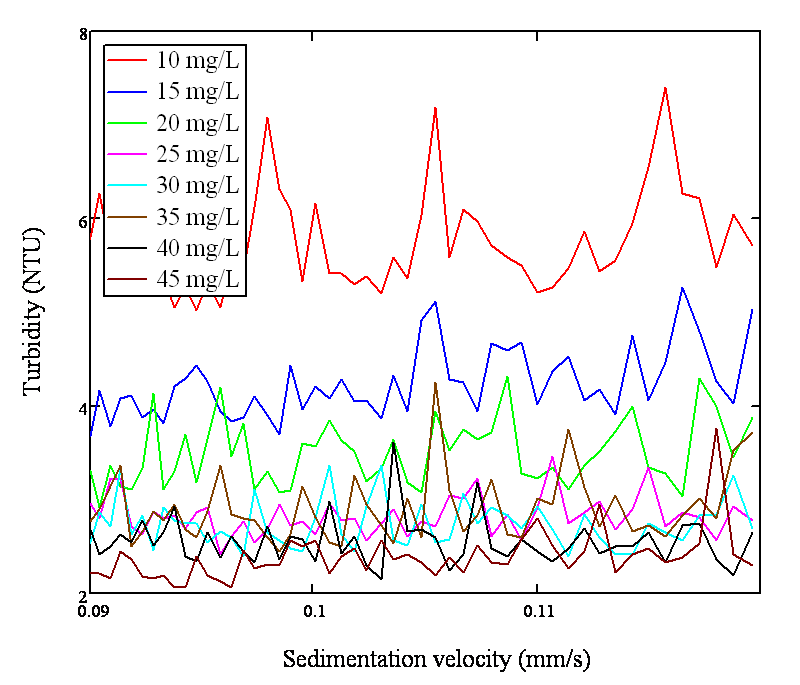
FIGURE 3A: The graph plots normalized turbidity vs. sedimentation velocity for each Alum dose ranging 10 mg/L~50 mg/L; FIGURE 3B: The graph plots the residual turbidity vs. sedimentation velocity for each Alum dose ranging 10 mg/L~50 mg/L
On October 20, 2009, an experiment was run with the set up of influent turbidity around 100 NTU, flocculator length of 2796 cm, flow rate of 5 mL/s, and an alum dosage ranging from 20 to 55 mg/L. The data obtained from this experiment was processed through Mathcad for a simplified overview of the results in graphic form.
...
4A 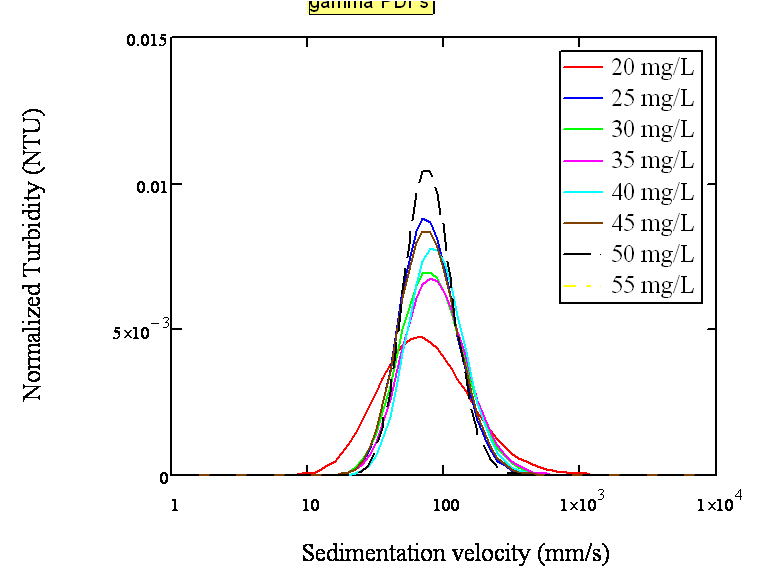
4B 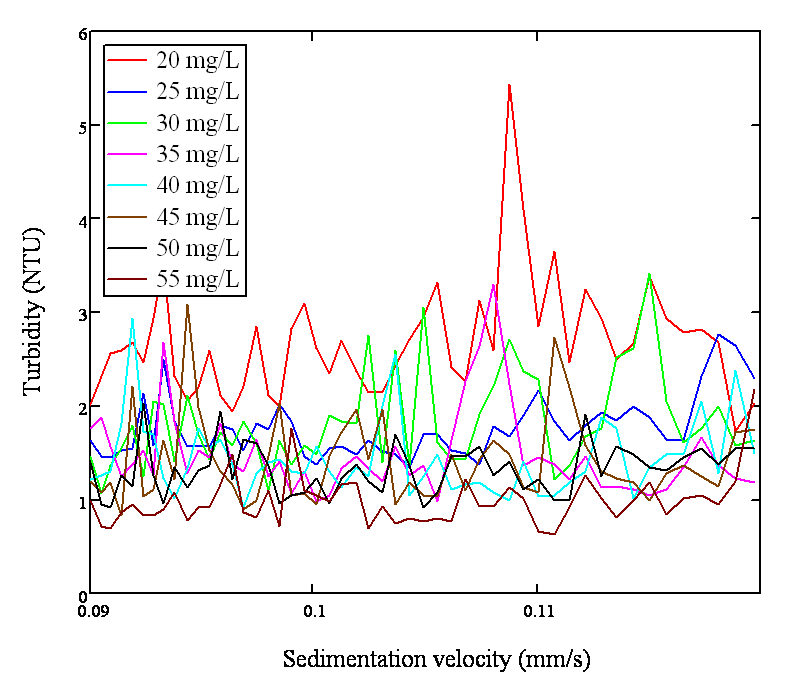
FIGURE 4A: The graph plots normalized turbidity vs. sedimentation velocity for each Alum dose ranging 20 mg/L~55 mg/L; FIGURE 4B: The graph plots the residual turbidity vs. sedimentation velocity for each Alum dose ranging 20 mg/L~55 mg/L
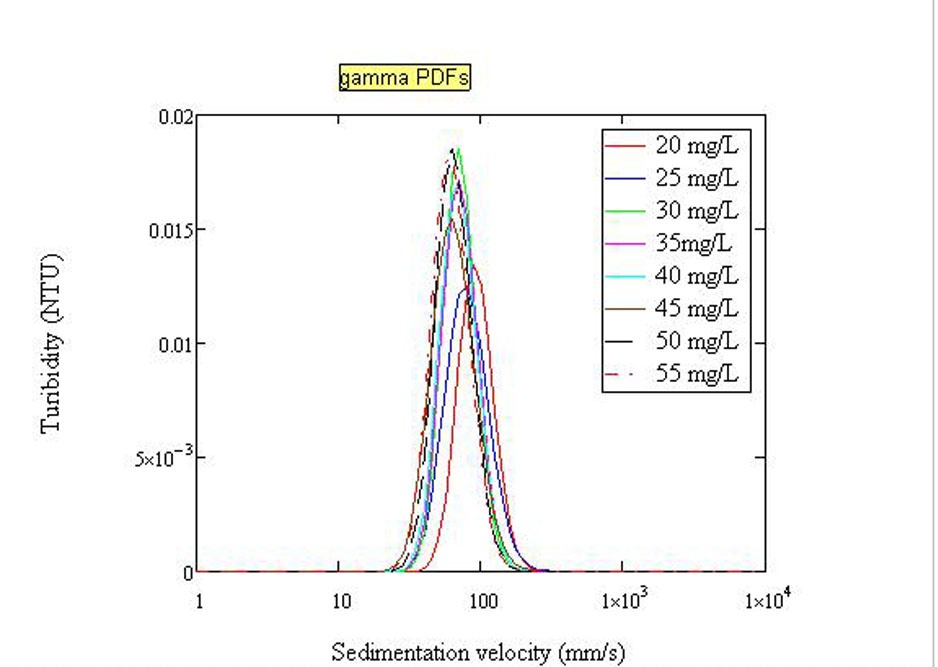
On November 18, 2009, an experiment was ran with the set up of influent turbidity around 100 NTU, flocculator length of 8800 cm, flow rate of 5 mL/s, and an alum dosage ranging from 20 to 55 mg/L.
...
5A
5B
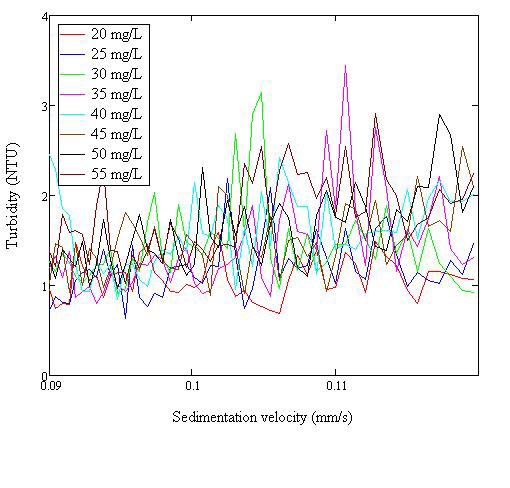
FIGURE 5A: The graph plots normalized turbidity vs. sedimentation velocity for each Alum dose ranging 20 mg/L~55 mg/L; FIGURE 5B: The graph plots the residual turbidity vs. sedimentation velocity for each Alum dose ranging 20 mg/L~55 mg/L
On Oct 27, 2009, another experiment was conducted with the turbidity set around 500 NTU, flocculator length 2796 cm, flow rate of 5 mL/s, and alum dosage ranging from 10 to 90 mg/L.
...
6A 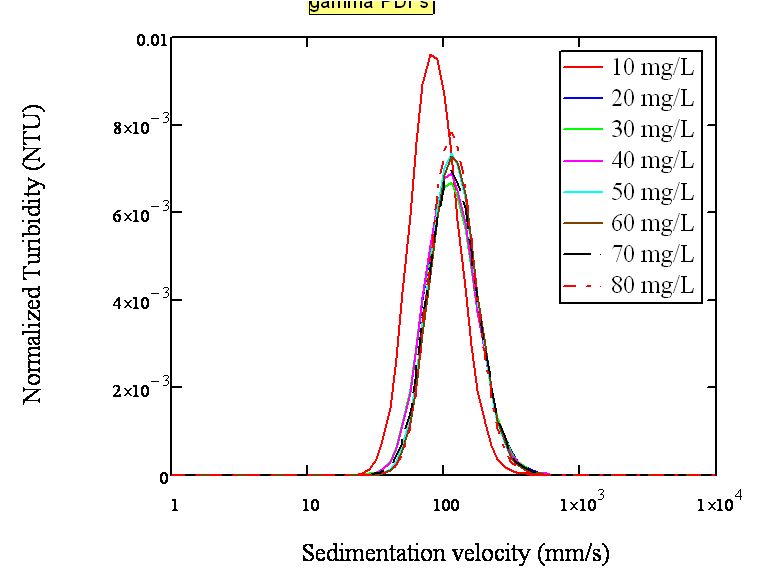
6B 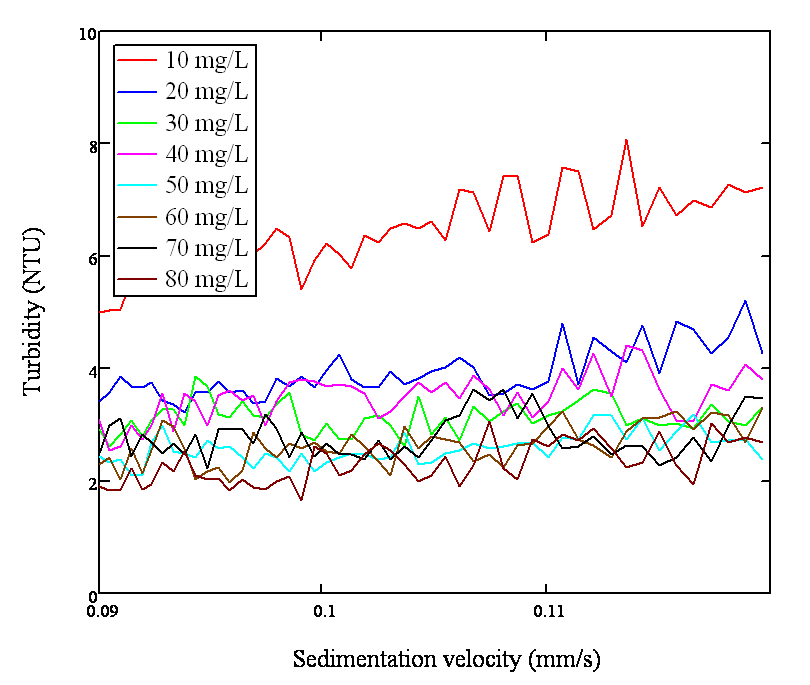
FIGURE 6A: The graph plots normalized turbidity vs. sedimentation velocity for each Alum dose ranging 10 mg/L~90 mg/L; FIGURE 6B: The graph plots the residual turbidity vs. sedimentation velocity for each Alum dose ranging 10 mg/L~90 mg/L
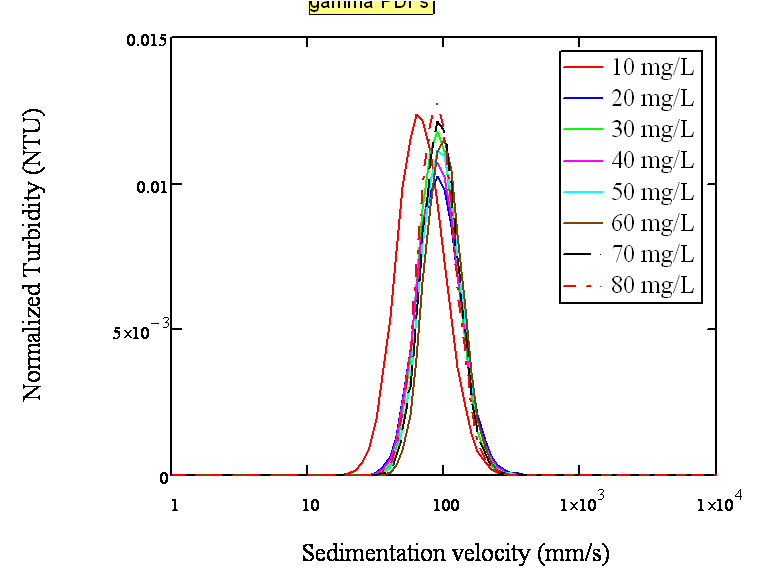
On Nov 19, 2009, another experiment was conducted with the turbidity set around 500 NTU, flocculator length 8388 cm, flow rate of 5 mL/s, and alum dosage ranging from 10 to 90 mg/L.
...
7A
7B
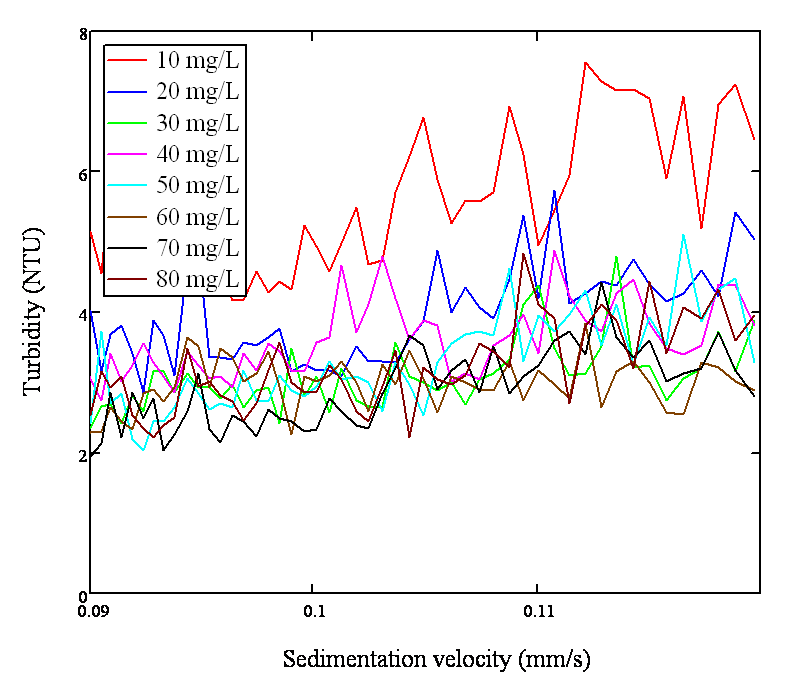
FIGURE 7A: The graph plots normalized turbidity vs. sedimentation velocity for each Alum dose ranging 10 mg/L~90 mg/L; FIGURE 7B: The graph plots the residual turbidity vs. sedimentation velocity for each Alum dose ranging 10 mg/L~90 mg/L