*** This version of Confluence is for testing only and contains a copy of content from June 29th 2026. No changes will be preserved. ***

...
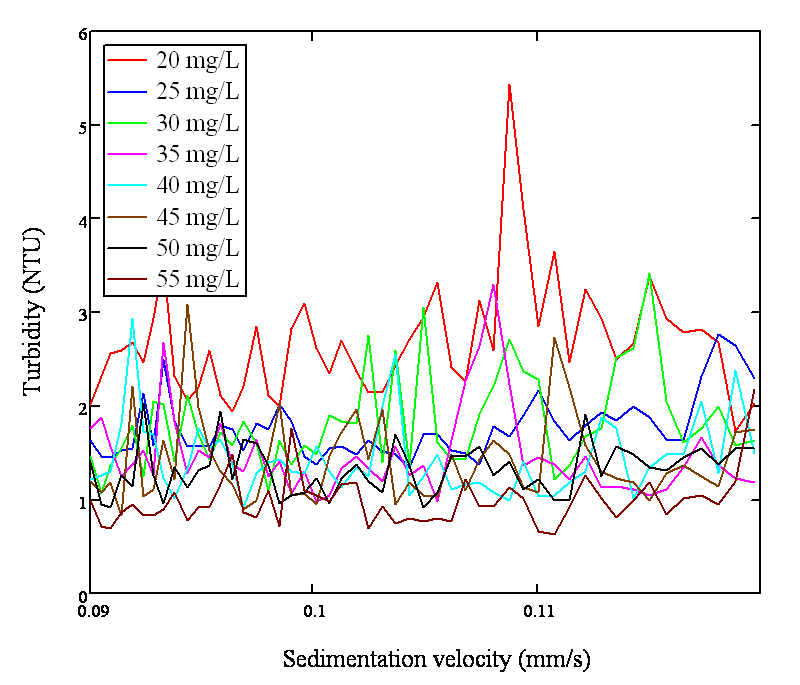
FIGURE 1: The graph plots the residual turbidity vs. sedimentation velocity for each Alum dose ranging 20 mg/L~55 mg/L
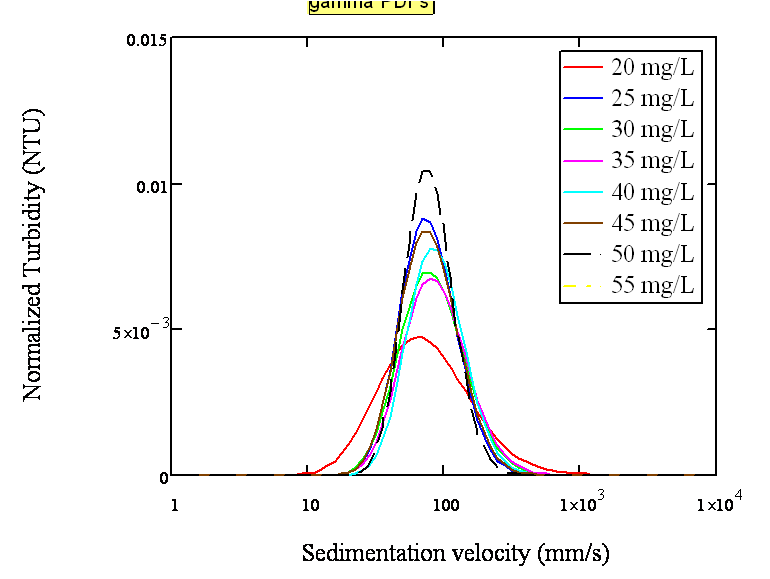
FIGURE 2: The graph plots normalized turbidity vs. sedimentation velocity for each Alum dose ranging 20 mg/L~55 mg/L