*** This version of Confluence is for testing only and contains a copy of content from June 29th 2026. No changes will be preserved. ***

...
This experiment starts (use past tense in talking about experiment) with a flow rate of 6 mL/min and over the course of 24 hours, gradually increases to a flow rate of 50 mL/min. This flow rate range corresponds to a capture velocity range of approximately 11 m/day to 91 m/day.
...
The very clear spike in the data represents the point at which the floc particles began to roll up the tube settler, which was confirmed visually in the experimental apparatus. The velocity represents the critical velocity. At a certain velocity, the turbidity stabilizes, and stops increasing. This is because at a certain point, the number of flocs rolling up in the settler cannot increase anymore, therefore the turbidity cannot increase anymore. Given the current data that has been collected, we are not sure if this curve accurately represents how the turbidity should change during the ramp state function. (Compare this with your theory. Is this what you expected?)
This experiment starts with a flow rate of 6 mL/min and gradually increases to a flow rate of 140 mL/min over the course of 24 hours. This flow rate range corresponds to a capture velocity range of approximately 11 m/day to 256 m/day (Put in mm/s units!).
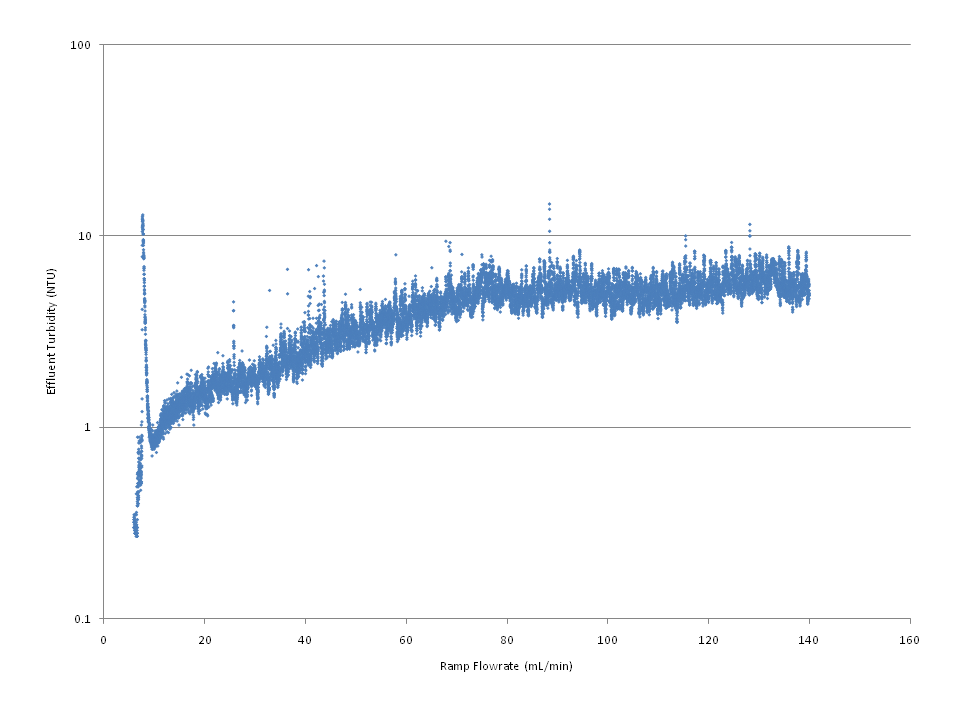
Figure 1: Effluent Turbidity vs. Flow Rate
...
Unlike the results for the 9.5mm tube, there isn't a sharp increase in the turbidity. Although the turbidity of the effluent water increases, the increase in the turbidity is minimal compared to the 9.5 mm tube. Although the tubidity is slightly higher than our standard of 1 NTU, this is not a significant enough difference to assume that floc roll-up has occured. Thus, there is no clear evidence of floc roll up. (Why is this the case? Did theory predict that floc roll-up would occur? Can you speculate why this did not happen? Should you test at higher velocities?)