 Sign-up for free online course on ANSYS simulations!
...
Does the simulation result compares well with the experimental data?
Axial Velocity Profile
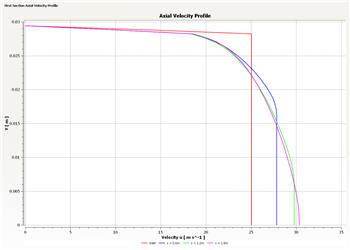
Now let's us look at the axial velocity profile at various location in the pipe. We are interested in the flow development before the heated section and would like to observe how heat addition in the heated section will affect the flow development. To do this, let's start with investigation the flow before the heated section.
...
Axial Velocity Profile before Heated Section
...
The heated section is from 1.83m to 4.27m. Let's create 4 lines before 1.83m in the pipe.
Insert > Location > Line
Name it "Inlet" and click OK. On the lower left panel, you will see Details of Inlet. Enter the following coordinates.
Point 1 (0,0,0)
Point 2 (0,0.0294,0)
Enter 50 for Samples. (This will be the number of sample points used when plotting data)
Click Apply.
Create Preheat 1.
Insert > Location > Line
Name it "Preheat 1" and click OK. On the lower left panel, you will see Details of Preheat 1. Enter the following coordinates.
Point 1 (0.6,0,0)
Point 2 (0.6,0.0294,0)
Enter 50 for Samples. (This will be the number of sample points used when plotting data)
Click Apply.
Continue the same step for creating line Preheat 2 (x=1.2m), Preheat 3 (x=1.8m).
Check that you have the following under Outline.
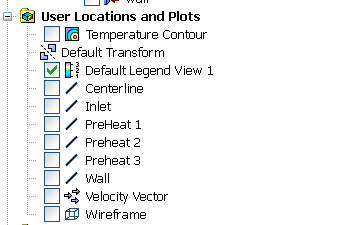
Now we will have enough interval to look at the flow development before the heating. Let's create a chart to investigate this.
Insert > Chart
Enter "First Section Axial Velocity Profile" as Name. You will see Details of First Section Axial Velocity Profile appear on the lower left panel. Under General, give the chart Title as "Axial Velocity Profile".
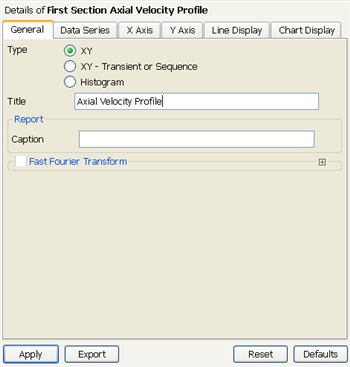
Now click on Data Series tap to specify the location of the chart data. Create a new data series  . Under Data Source, specify Inlet as Location. Change the name to Inlet. Continue adding Data Source until we added all Inlet, Preheat 1, Preheat 2, and Preheat 3. Name them according to the figure shown below.
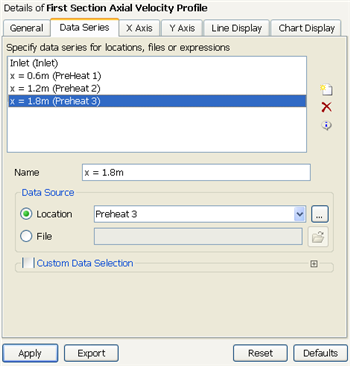
Now we will specify the X Axis parameter. Click on X Axis tab. Next to Variable, choose Y. Next we will specify the Y Axis parameter. Click on Y Axis tab. Next to Variable, choose Velocity. Click Apply. You will see First Section Axial Velocity Profile created under Report in the Outline tab.
This is what you should see in the Graphics window.
| newwindow | ||||
|---|---|---|---|---|
| ||||
https://confluence.cornell.edu/download/attachments/111221576/Axial%20Velocity%20Profile.png |
Axial Velocity Profile before and after Heated SectionThe heated section is from 1.83m to 4.27m. Let's create 4 lines before 1.83m in the pipe.
Insert > Location > Line
Name it "Postheat 1" and clickOK. On the lower left panel, you will seeDetails of Postheat 1. Enter the following coordinates.
Point 1 (4.27,0,0)
Point 2 (4.27,0.0294,0)
Enter 50 forSamples. (This will be the number of sample points used when plotting data)
ClickApply.
Create Postheat 2.
Insert > Location > Line
Name it "Postheat 2" and clickOK. On the lower left panel, you will seeDetails of Postheat 2. Enter the following coordinates.
Point 1 (5,0,0)
Point 2 (5,0.0294,0)
Enter 50 forSamples. (This will be the number of sample points used when plotting data)
ClickApply.
Continue the same step for creating line Outlet (x=6.096m)
Check that you have the following under Outline.
Now we will have enough interval to look at the flow development before and after the heating. Let's create a chart to investigate this.
Insert > Chart
Enter "Second Section Axial Velocity Profile" asName. You will seeDetails of Second Section Axial Velocity Profileappear on the lower left panel. UnderGeneral, give the chartTitleas "Axial Velocity Profile".
Now click onData Seriestap to specify the location of the chart data. Create a new data series. UnderData Source, specifyPreheat 3asLocation. Change the name to x=1.8m. Continue adding Data Source until we added allPreheat 3, Postheat 1, Postheat 2, andOutlet. Name them according to the figure shown below.
Now we will specify the X Axis parameter. Click onX Axistab. Next toVariable, chooseY. Next we will specify the Y Axis parameter. Click onY Axistab. Next toVariable, chooseVelocity. ClickApply. You will seeFirst Section Axial Velocity Profilecreated underReportin theOutlinetab.
This is what you should see in the Graphics window.
| newwindow | ||||
|---|---|---|---|---|
| ||||
https://confluence.cornell.edu/download/attachments/111221576/Axial%20Velocity%20Profile.png |
Go to Step 7: Verification & Validation
...