*** This version of Confluence is for testing only and contains a copy of content from June 29th 2026. No changes will be preserved. ***

...
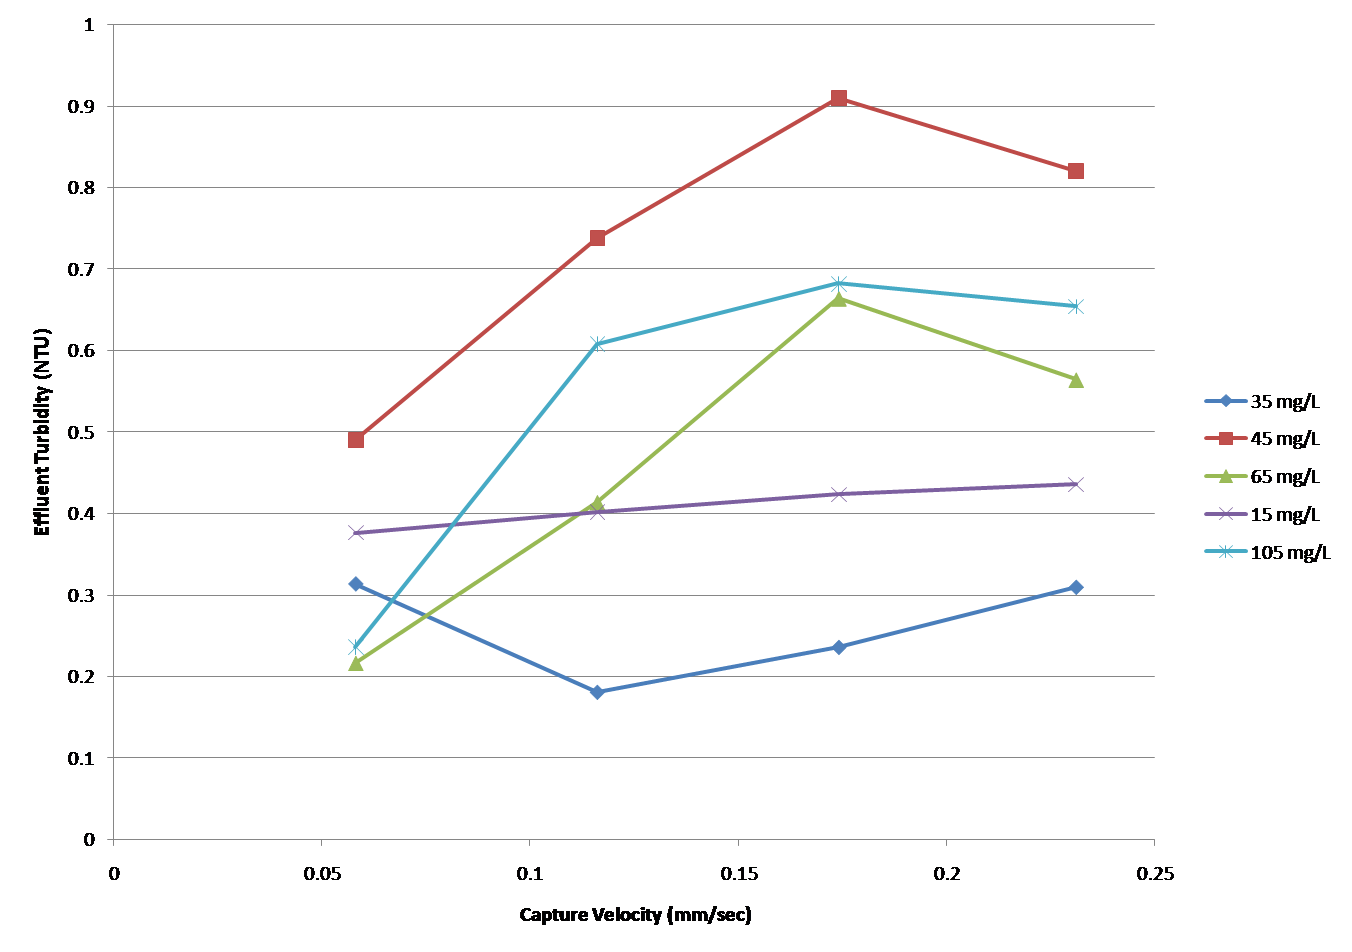
Figure 1: Capture Velocity vs. Average Effluent Turbidity shown for each alum dose at low floc blanket level.
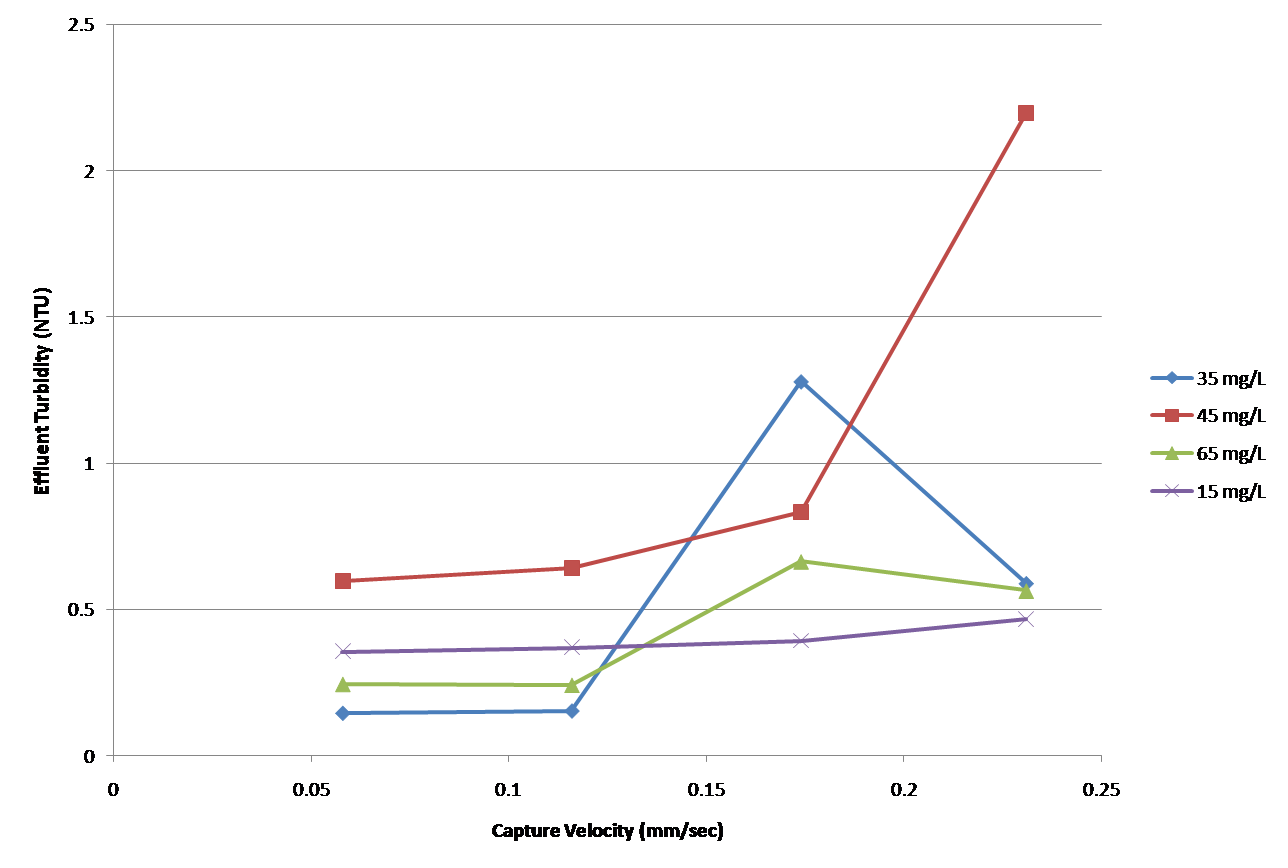
Figure 2: Capture Velocity vs. Average Effluent Turbidity shown for each alum dosage at high floc blanket level.
|| Floc Blanket Height || Alum Dose (mg/L) || 0.058 mm/s || 0.116 mm/s || 0.174 mm/s || 0.231 mm/s ||
Low | 15 | .3762 | .4013 | .4233 | .4352 |
High | 15 | .3548 | .3699 | .3914 | .4653 |
Low | 35 | .3136 | .1799 | .2353 | .3093 |
High | 35 | .1457 | .1535 | 1.278 | .5889 |
Low | 45 | .7667 | .7374 | .9094 | .8192 |
High | 45 | .5946 | .6407 | .8321 | .5638 |
Low | 65 | .2155 | .4129 | .6635 | .5637 |
High | 65 | .2446 | .2414 | .6634 | .5637 |
Low | 105 | .2357 | .6077 | .6820 | .6541 |
The above table shows the average effluent turbidities for each alum dosage, floc blanket state and capture velocity.
Overall, this system performed well and most of the effluent turbidities were below 1 NTU. The ideal alum dose of 45 mg/L and the slight underdose and overdose of 35 mg/L and 65 mg/L, respectively, performed best. Because the "overdose" and "underdose" did not fail, as expected, it was necessary to test more extreme doses. We tested 15 mg/L and 105 mg/L to observe more severe conditions. The extreme overdose of 105 mg/L demonstrated failure, as expected. The 15 mg/L extreme underdose, however, did not experience failure.
...