*** This version of Confluence is for testing only and contains a copy of content from June 29th 2026. No changes will be preserved. ***

...
This is an underdose. These graphs show the effluent turbidity plotted against time for capture velocities of 0.058, 0.116, 0.174, and 0.231 mm/sec.
. 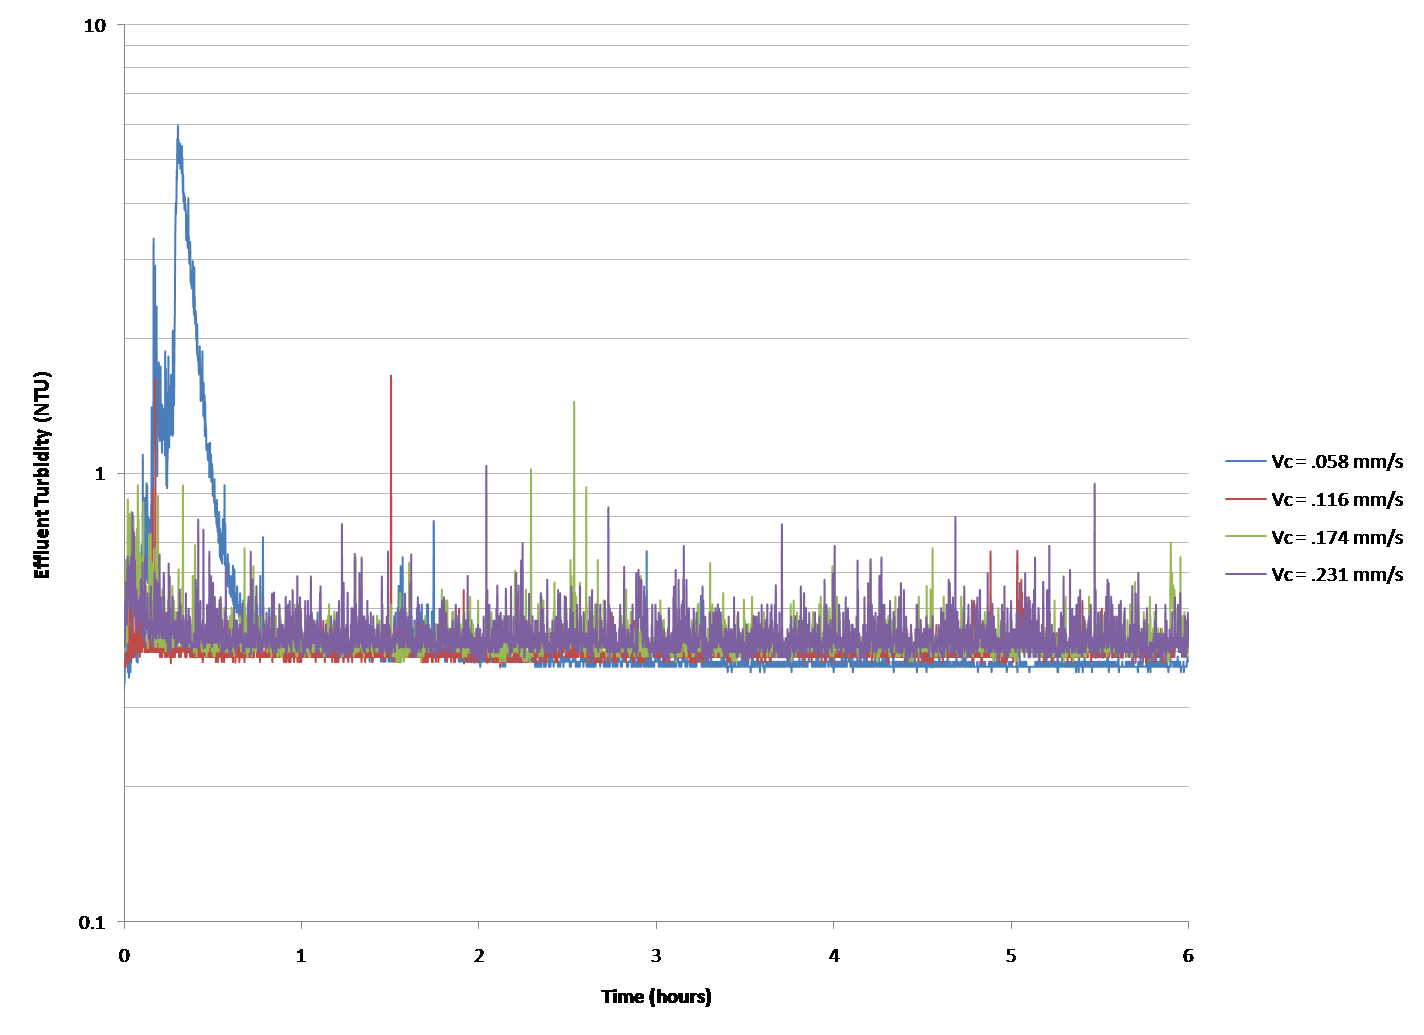
Figure 1: Effluent Turbidity vs. Time for Floc Blanket on low, alum dose = 15 mg/L
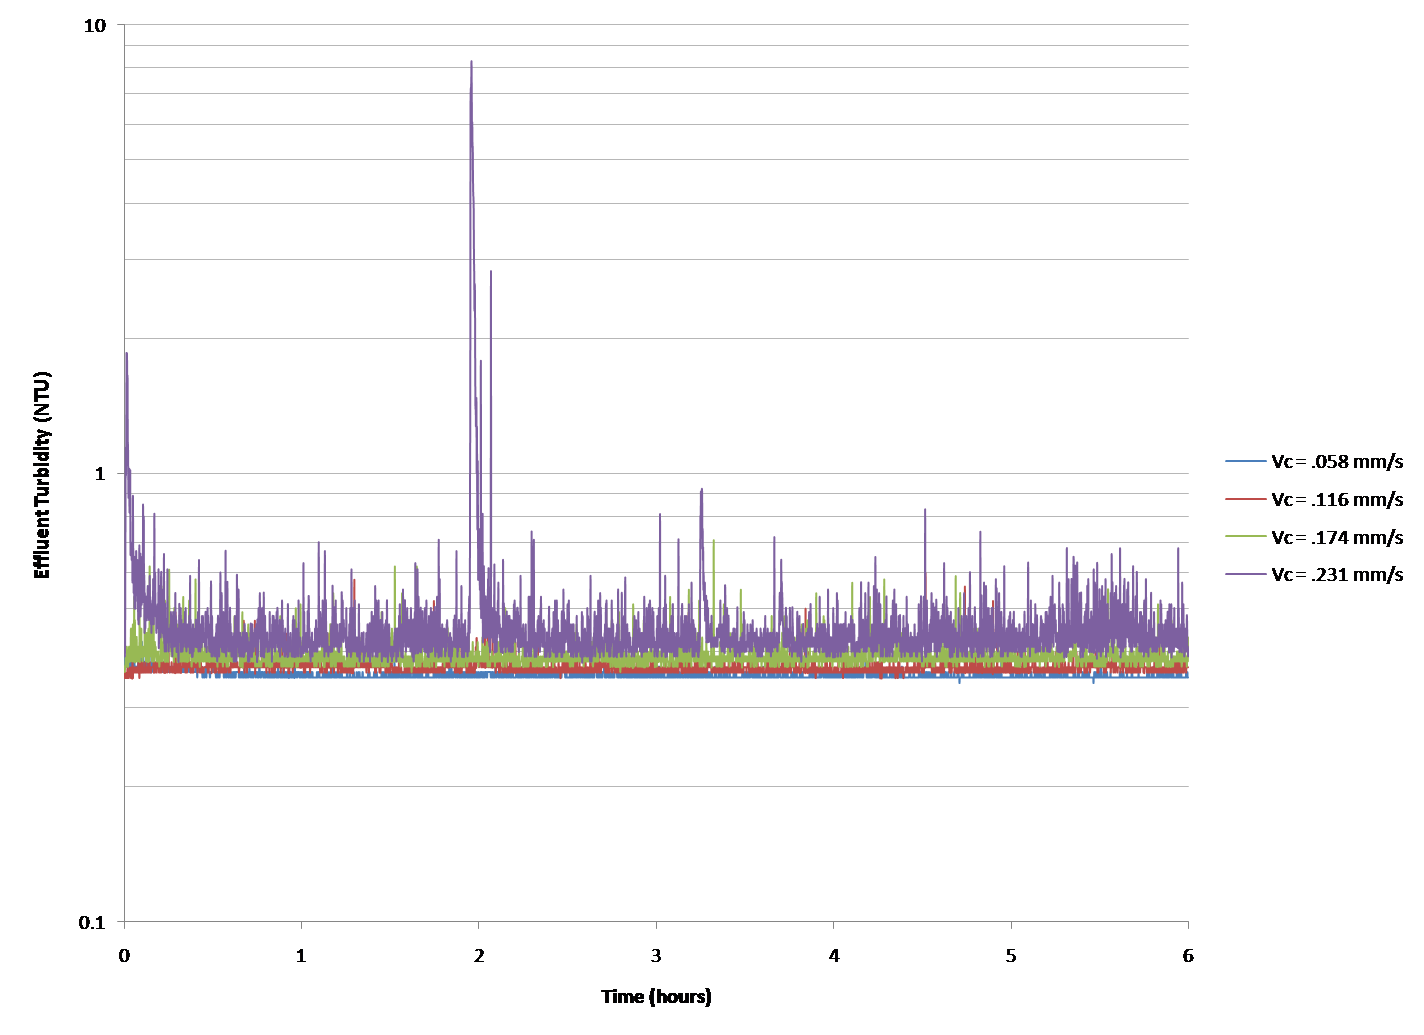
Figure 2: Effluent Turbidity vs. Time for Floc Blanket on high, alum dose = 15 mg/L
...
This unexpectedly performed well, excpet the floc blanket took a long time to form.