 Sign-up for free online course on ANSYS simulations!
...
Main Menu > Display > Contours
 \\\\
\\\\
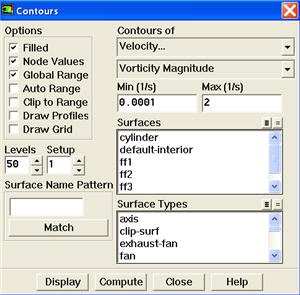
Under Contours of, choose Velocity.. and Vorticity Magnitude. Disable Auto Range and Clip to Range from the Options group box. Enter 0.0001 and 2 for Min and Max, respectively. Select Levels to 50. Click Display.
//  //
//
| newwindow | ||||
|---|---|---|---|---|
| ||||
https://confluence.cornell.edu/download/attachments/107011458/velocity%20magnitude%20contour%20plot_sm.jpg |
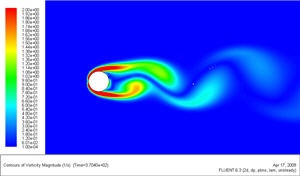
This figure shows clear vortex shedding process. Zoom in the view around cylinder.
...