*** This version of Confluence is for testing only and contains a copy of content from June 29th 2026. No changes will be preserved. ***

Using the This experiment looked at the possibility of deviation from the Hagen-Poiseuille equation for calculation of flow rate through a tube. The new flow control apparatus , was used to measure flow rates were calculated relative to given head loss and . When plotted against the expected values of the Hagen-Poiseuille equation to analyze divergence from the mathematical model and provide an idea of how the application of equations should be affected to provide a better model for realitya strong divergence was noted. Variables such as tube length and tube diameter were varied/tested to find possible causes of deviation.
...
The tested apparatus was constructed as follows.The constant head tank was constructed using two elevated buckets. The storage was significantly larger and with a larger diameter than the actual constant head bottle. They were connected by a single tube which went from the base of the stock tank and into the top portion of the bottle where the float was located. From the bottom of the bottle was a from which the dosing tube was attached. This tube is adjustable to allow for different lengths. A PVC pipe was procured and sealed on the bottom and placed in a wooden base to stabilize it. In this, along the top 26 centimeters, 26 7 mm holes were drilled. The top hole had its center line leveled with the water level in the constant head bottle so that ever additional hole below was another centimeter of head loss.
To cut off additional flow into the constant head tank, the force exerted on the float, i.e. the buoyant force, must be equal to the force exerted by the water attempting to leave, i.e. the force of the water column in the stock tank. The buoyant force is the force exerted by the amount of water displaced by the float. As such, there is a relationship between the height of water in the stock tank and the amount of water displaced by the float in the constant head tank. Since explained on the previous page. Since it has been determined that the water level in the constant head tank is affected by the water level in the stock tank, before each iteration of the experiment, the water collected from the previous test is replaced to keep the water constant. Data is collected via the EasyData program which collects voltage output for a 7 kPa pressure sensor.
At first, increments of 25 mL were placed over the sensor, into the tube of the experimental apparatus to obtain a direct conversion value between voltage and volume of water. This allowed for a direct change of voltage to volume and thus a simpler calculation of . Finding a direct conversion between the voltage and flow rate allowed the graph of voltage vs. time to be converted directly to volume vs. time. The derivative of this would then be the flow rate through the tube.
After this conversion value was determined, the The flow rate test was commenced. After the constant head tank was filled and the stock tank was prepared, the distribution tube was measured for a series of tubing lengths and head losses. The stock tank was cleaned with distilled water and then filled with distilled water and attached to the constant head tank. The distribution tube, the tube exiting the constant head tank and entering the tube of the testing apparatus, was placed in a hole on the apparatus such that a known head loss was inducedobtained. Using Easy Data, a plot of voltage vs. time was constructed. Transforming voltage to volume produced volume vs time. The derivative of this graph is the flow rate out of the dosing tube. The procedure was varied using differing head losses and different tubing lengths.
...
The test was run for two different tube lengths, 1 m and 44.5 cm. The test was run at many different flow rates from head loss of 3 cm to 25 cm. The plants in Honduras induceuse, at the most, a head loss of 20cm20 cm. The test was meant to also allow for an end behavior analysis for over dosing.testing of up to 25 cm head loss allowed for an analysis of even higher flow rates, in case there was little to no deviation at the lower flow rates
<<<<intert image here. Use a line, no grey back ground, and change legend labels>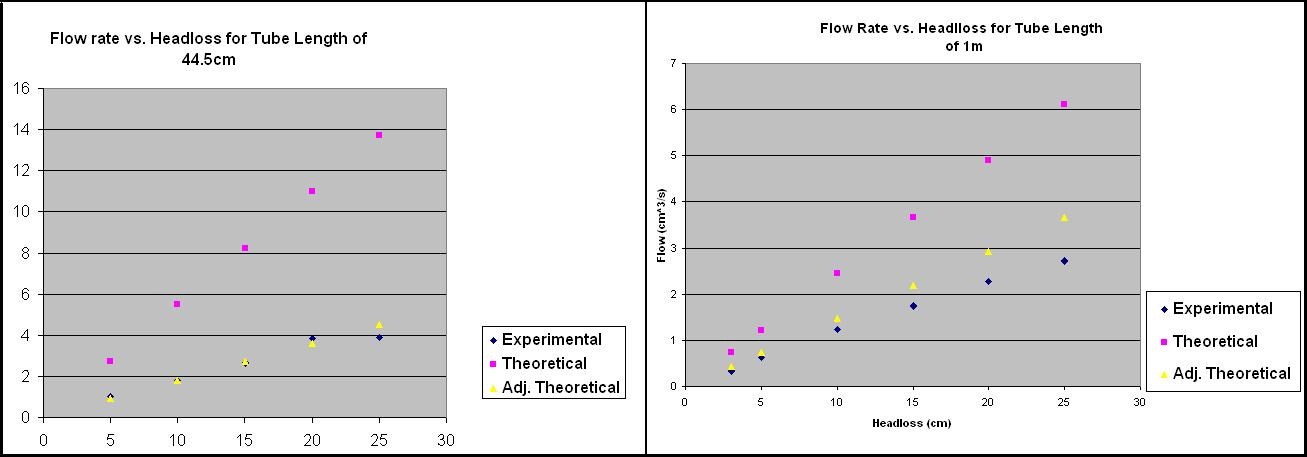
The head losses were taken from the experiment such that one hole below the base hole was only 1 cm of head loss. The length of the tubes, 44.5 cm and 1 m, were measured. The inner diameter was 1/8 in as given by the manufacturer for the experimental. The correction was applied to this diameter.
...
This experiment confirmed that the Hagen-Poiseuille equation overestimated the actual flow rate and thus was providing an inaccurate estimate. However, the extent of this over /under estimation was previously difficult to determine. However, what is most interesting is the validity of the supposed tubing inner diameter correction. Using the values calculated from the experiments regarding the tube diameter provided a drastic improvement which may be a correction that could be the correct calculationmakes the equation a better model. Also, because the inner diameter of the tube was 1/8th of an inch, small variation in inner diameter produce large changes in the dataterms of particle movement within the tube and thus head loss and the Hagen-Poiseuille equation. Getting a more accurate image of the inside of the tube allows for the equation to operate more predicatively. Varying tube diameters should be tested to find if these minor inner diameter variations are negligible at larger diameters. Varying tube lengths should be tested to consider the possibility of non-negligible minor head losses which, when considered, provide better fits to the calculated graphs.